

21st March 2017 – 16:00- Seminar Room- Prof. Vito Di Noto
Department of Industrial Engineering – University of Padova
Seminar Title:
Conductivity and Relaxation Phenomena in Ion Conducting Materials by Broadband Electric Spectroscopy
Abstract:
Section of Chemistry for Technology, Department of Industrial Engineering, University of Padova, Via Marzolo 1, I-35131 Padova (Italy)
e-mail: vito.dinoto@unipd.it
Ionically conducting materials (ICM) are of great importance for the fabrication of portable batteries for electronic devices such as computers, tools, video and still cameras, and for the development of fuel cell and battery-powered electric vehicles, dye-sensitized solar cells, supercapacitors and sensors.1
It has been suggested that conductivity in ICMs occurs via a number of different processes. The predominant conductivity processes are attributed to: a) the charge migration of ions between coordination sites in the host materials;2-5 and b) the increase of conductivity due to relaxation phenomena involving the dynamics of the host materials.2-5 Ions “hopping” to new chemical environments can lead to successful charge migration only if ion-occupying domains relax via reorganizational processes,2-5 which generally are coupled with relaxation events associated with the host matrix.
Here, it will be described in a concise fashion, the instruments used to comprehensively study the electric response of ionic conductors. To provide the reader with the basic tools necessary for understanding broadband electric spectroscopy,6-8 the first part will review the general phenomena and basic theory behind each type of electric response that materials may exhibit when they are subjected to static or dynamic electric fields. This will be achieved by focusing on the practical use of equations, while referring to specialized literatures for detailed explanations of the equations. The second part of this presentation will describe in detail the strategies of data analysis, which is accomplished using specific empirical or theoretical models (Fig. 1). The third part will detail the methodologies for accurate data collection.
(1) Polymer Electrolytes: Fundamentals and Applications; Sequeira, C.; Santos, D., Eds.; Woodhead Publishing Limited: Oxford, 2010.
(2) Di Noto, V. J. Phys. Chem. B 2000, 104, 10116.
(3) Di Noto, V.; Vittadello, M.; Lavina, S.; Fauri, M.; Biscazzo, S. J. Phys. Chem. B 2001, 105, 4584.
(4) Di Noto, V. J. Phys. Chem. B 2002, 106, 11139.
(5) Di Noto, V.; Vittadello, M.; Greenbaum, S. G.; Suarez, S.; Kano, K.; Furukawa, T. J. Phys. Chem. B 2004, 108, 18832.
(6) Di Noto, V.; Giffin, G. A.; Vezzù, K.; Piga, M.; Lavina S. Broadband Dielectric Spectroscopy: A Powerful Tool for the Determination of Charge Transfer Mechanisms in Ion Conductors, in Solid State Proton Conductors: Properties and Applications in Fuel Cells, P. Knauth, M. L. Di Vona, Eds., John Wiley & Sons Weinheim, Germany, 2012.
(7) Runt, J. P.; Fitzgerald, J. J. Dielectric Spectroscopy of Polymeric Materials: Fundamentals and Applications; American Chemical Society: Washington, D.C., 1997.
(8) Schoenhals, A.; Kremer, F. Broadband Dielectric Spectroscopy; Springer-Verlag: Berlin, 2003.
(9) Di Noto, V.; Guinevere, G.A.; Vezzù, K.; Nawn, G.; Bertasi, F.; Tsai, T.-H.; Maes, A.; Seifert, S. ; Coughlin, B.; Herring, A. Interplay between solid state transitions, conductivity mechanism, and electrical relaxations in a [PVBTMA][Br]-b-PMB diblock copolymer membrane for electrochemical applications. Phys Chem Chem Phys 2015, 17, 31125-311139.
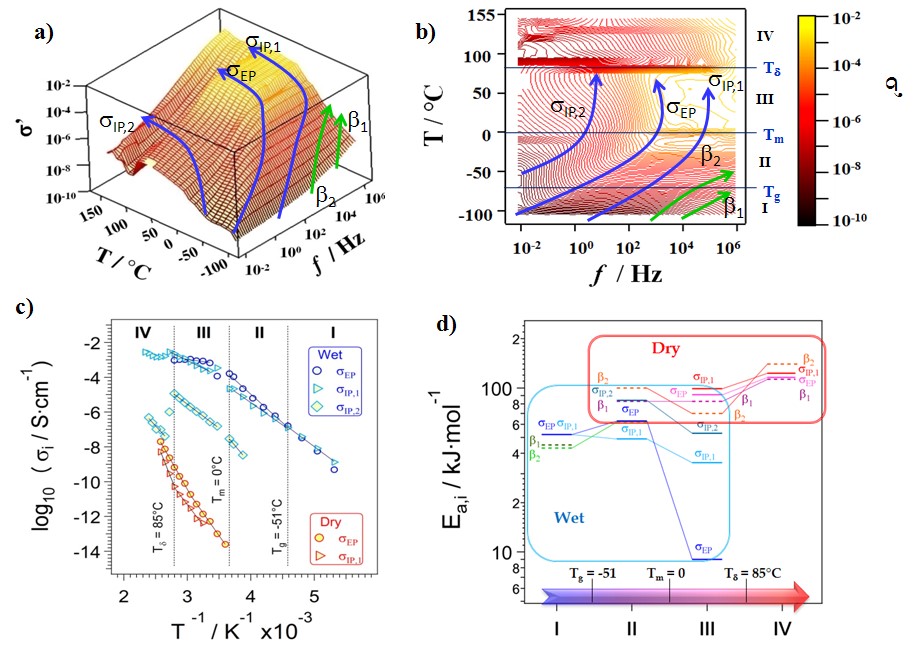
Fig.1. Three-dimensional surface (a) and contour plot (b) of s’(w) profiles of an anionic membrane9. Dependence of conductivity si (si =sEP, sIP,1and sIP,2) on the inverse of temperature (1/T) (c). si values are determined by fitting simultaneously the profiles of s*(w), e*(w) and tand(w) with Eq. 1. si vs 1/T curves of dry and wet samples in I, II, III and IV regions, delimited by thermal transitions Tg, Tm and Td, are fitted by Arrhenius-like behaviours (c). Activation Energies (Ea,i) of si (si =sEP, sIP,1 and sIP,2) and fi dielectric modes (i=b1 and b2) ) in regions I, II, III and IV.